
What Is OEE, and How Can Factories Measure It Automatically?
A machine can be switched on for an entire shift and still produce less than expected. It may stop repeatedly, run below its intended speed, or produce items that need to be rejected. Looking only at machine uptime misses two of those problems.
Overall Equipment Effectiveness (OEE) combines availability, performance, and quality into one measure of how effectively planned production time is used. It helps a factory locate losses and decide what to investigate first.
The three parts of OEE
Availability measures the share of planned production time during which the equipment was running.
Availability = Run Time ÷ Planned Production Time
Performance compares actual output with the output the equipment could have produced at its defined ideal cycle time.
Performance = Ideal Cycle Time × Total Count ÷ Run Time
Quality measures the share of produced units that meet the agreed quality standard.
Quality = Good Count ÷ Total Count
Multiply the three results to calculate OEE:
OEE = Availability × Performance × Quality
NIST describes OEE as the product of equipment availability, performance, and quality. The value of the calculation depends on consistent definitions and reliable input data. [1]
A simple factory example
Suppose a line has 480 minutes of planned production time in a shift. It stops for 60 minutes, leaving 420 minutes of run time. Its ideal cycle time is one minute per unit. It produces 360 units, of which 342 are good.
MeasureCalculationResult
Availability
420 ÷ 480
87.5%
Performance
360 ÷ 420
85.7%
Quality
342 ÷ 360
95%
OEE
87.5% × 85.7% × 95%
71.25%
This does not mean every factory should target the same OEE percentage. The useful question is where this particular line lost planned production time. In the example, the team can examine the 60 minutes of stops, the gap between actual and ideal running speed, and the 18 rejected units.
Why manual OEE reports can be unreliable
A spreadsheet may be sufficient for a small pilot, but manual reporting becomes harder when there are many machines, shifts, and short stoppages. Operators may record a stop after the event, use different reason names, or leave the reason blank. Production counts and quality results may arrive from separate systems.
The result can be a precise-looking OEE percentage built from inconsistent data. Before automating the calculation, agree on:
- What counts as planned production time and which breaks or shutdowns are excluded.
- When a machine is considered running, stopped, or idle.
- How the ideal cycle time is set for each product.
- Whether good count means first-pass accepted units.
- Who assigns and reviews downtime reasons.
Keep these definitions stable when comparing shifts or sites.
How automatic OEE measurement works
An industrial IoT system can collect machine run status and production counts from available PLC signals or suitable sensors. The system timestamps each change and assigns it to the correct asset and shift.
Operators still have an important role. A machine signal can show that production stopped, but it may not reveal whether the cause was a roll change, cleaning, missing material, a mechanical fault, or scheduled maintenance. A simple reason-entry workflow adds that context.
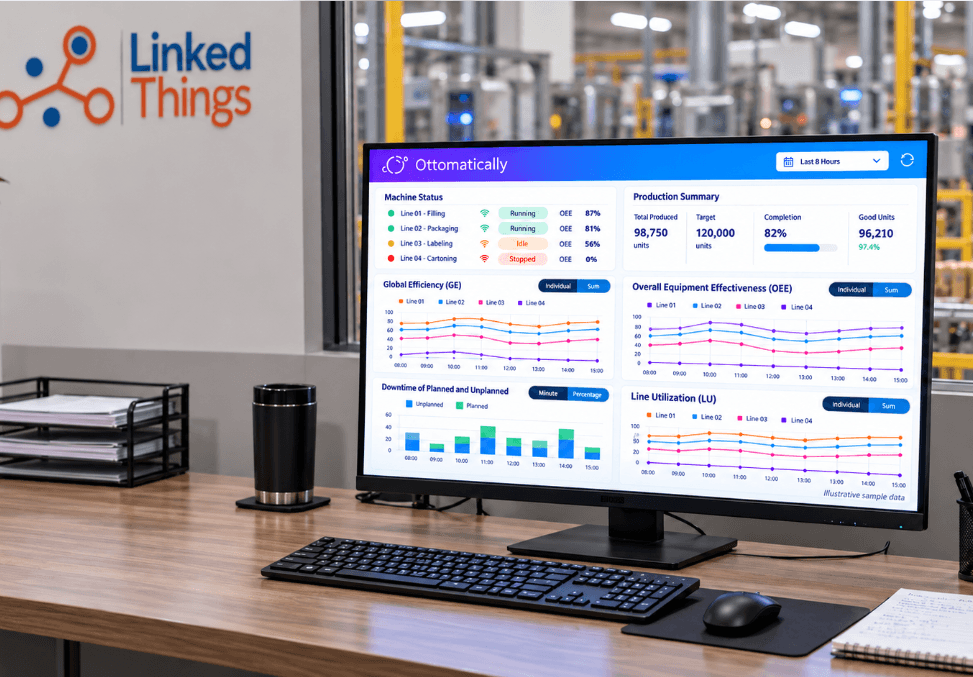
Quality data completes the picture. Depending on the process, accepted and rejected counts may come from a counter, inspection system, or a verified operator entry. The dashboard then calculates availability, performance, quality, and OEE from the same defined reporting period.
Linked Things’ Smart Industries solution describes sensor-based production and downtime monitoring with real-time efficiency calculations. The aim is to make the losses visible while the team can still respond—not just produce a percentage at the end of the month.
Use OEE to improve a process, not rank people
A useful OEE dashboard lets a production team move from the headline number to the underlying events:
- Find the largest loss. Is the main issue stoppage time, reduced speed, or rejected output?
- Review its context. Which machine, product, shift, and reason are involved?
- Take an action. Assign an owner and record the maintenance or process change.
- Measure again. Compare similar production conditions before and after the change.
For example, if a line repeatedly stops during roll changes, the team can examine the changeover procedure. If the line runs continuously but below its defined speed, the investigation should focus on a different cause. OEE points the team toward the question; operators and engineers determine the answer.
Start with one line
A practical first step is to monitor one production line, verify its machine signals and counts, and review downtime reasons with the shift team. Once the data is trusted, the factory can expand the method to other lines.
OEE is most useful when everyone can trace the number back to real production events. If your team wants a clearer view of equipment performance and downtime, contact Linked Things to discuss an automatic monitoring pilot.